Modules/debug
From MSX Game Library
< Modules

The debug module offers features to create interaction between a running program and a debug device (generally, an emulator) to help programmers to debug their program.
Contents
Usage
To use this module, include "debug.h" in your source code, and add "debug" to the modules list (LibModules) in your project's configuration file (project_config.js).
Note: You don't need to remove the module from the compile list when you want to remove the debug features. Just disable the module from library configuration (msxgl_config.h) is enough to remove all module codes. Don't forgot to rebuild the library after changing configuration.
Emulators
 Emulicious
Emulicious support all avaible debug functions. Messages sent by the game are displayed in the debugger's "Console" tab.
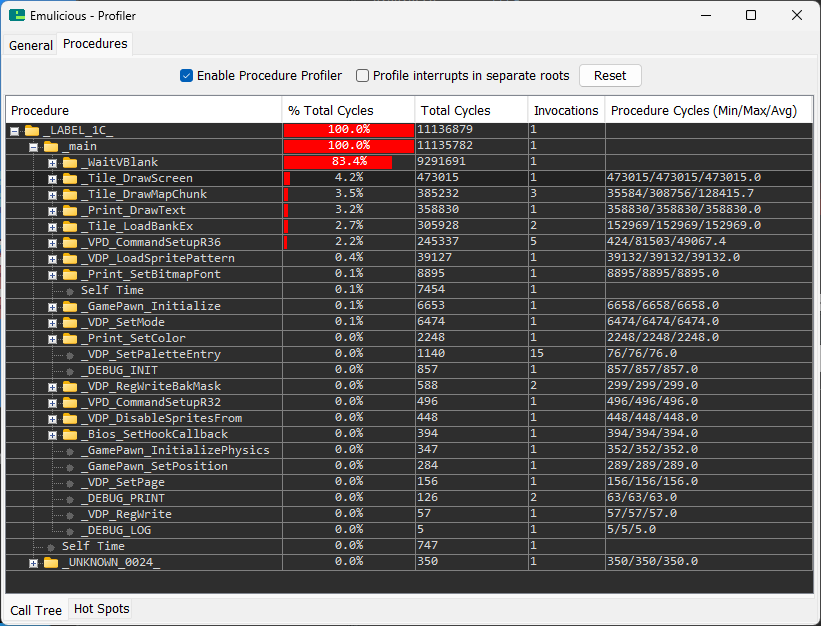
For profiling your program with Emulicious, you don't need to modify any thing in your code. Emulicious provide many debug tools, including a Profiler which lets you see which parts of your code take the longest (Call Tree), or which functions cost the most (Hot Spots).

It is recommended to call the DEBUG_INIT() function at the beginning of your program to mark the memory area reserved by the BIOS and let know the emulator to don't through warning when accessing this uninitialized memory.
 openMSX
By default, openMSX does not allow you to use all the features of the Debug module: DEBUG_BREAK(), DEBUG_ASSERT() et DEBUG_PRINT() are not supported.
To overcome this limitation, user PVM has developed a TCL script that adds the missing functionalities. To use it, set DEBUG_TOOL to DEBUG_OPENMSX_P in your library configuration (msxgl_config.h) and setup additionnal emulator command line in your project configuration (project_config.js):
//-- Emulator extra parameters to be add to command-line (string). Emulator sotfware specific
EmulExtraParam= `-script ${ToolsDir}script/openMSX/debugger_pvm.tcl`;
By default, openMSX has no code profiling tool either. 2 TCL scrips have been created to make up for this limitation. To use them, set PROFILE_TOOL to PROFILE_OPENMSX_G (Grauw's profiler) or PROFILE_OPENMSX_S (Sallute's profiler) in your library configuration file (msxgl_config.h).
You also need to add emulator command line in your project configuration (project_config.js):
For PROFILE_OPENMSX_G:
//-- Emulator extra parameters to be add to command-line (string). Emulator sotfware specific
EmulExtraParam= `-script ${ToolsDir}script/openMSX/profiler_grauw.tcl`;
For PROFILE_OPENMSX_S:
//-- Emulator extra parameters to be add to command-line (string). Emulator sotfware specific
EmulExtraParam= `-script ${ToolsDir}script/openMSX/profiler_salutte.tcl -command "profile::section_scope_bp frame 0xFD9F; profile_osd ms;"`;
If you don't know which one to choose, take the second one, which has a documentation: https://github.com/MartinezTorres/OpenMSX_profiler
Others
All other emulators are not known to offer debug communication or profiling and, thus, are not supported.
Samples
See module use cases in the sample programs:
- s_swtile (MSX2 sample that interact with debug device)
Settings
Debug
Library configuration (msxgl_config.h):
// Debugger options
// - DEBUG_DISABLE ................ No debug tool
// - DEBUG_EMULICIOUS ............. Debug features for Emulicious
// - DEBUG_OPENMSX ................ Debug features for openMSX using 'debugdevice' extension
// - DEBUG_OPENMSX_P .............. Debug features for openMSX using PVM script (tools/script/openMSX/debugger_pvm.tcl)
#define DEBUG_TOOL					DEBUG_DISABLE

// Profiler options
// - PROFILE_DISABLE .............. No profile tool
// - PROFILE_OPENMSX_G ............ Profiler features for openMSX using Grauw script (tools/script/openMSX/profiler_grauw.tcl)
// - PROFILE_OPENMSX_S ............ Profiler features for openMSX using Salutte script (tools/script/openMSX/profiler_salutte.tcl)
#define PROFILE_TOOL				PROFILE_DISABLE
#define PROFILE_LEVEL				10
Dependencies
Dependency on other modules: None
Documentation